

What Is XIRR in Mutual Fund – Have you ever opened your mutual fund app and noticed a percentage labeled XIRR, then wondered what it actually means?
Many new investors assume it is just another way of showing profit, but XIRR is much more than that. It is one of the most accurate methods used to measure the annual return on mutual fund investments, especially when you invest through a Systematic Investment Plan (SIP).
Unlike a one-time investment, SIPs involve multiple investments made on different dates. Because each installment has a different investment period, calculating returns becomes more complex than simply comparing the amount invested with the current value. This is where XIRR becomes essential.
XIRR helps investors understand the real annualized return on their investments by considering both the amount invested and the exact dates of every cash flow. Whether you invest monthly through an SIP, make additional lump sum investments, or redeem units at different times, XIRR provides a more accurate picture of your portfolio’s performance.
Understanding XIRR can help you:
- Measure the actual performance of your mutual fund investments
- Compare different mutual funds fairly
- Evaluate SIP returns accurately
- Make informed investment decisions
- Track long-term wealth creation
In this comprehensive guide, you’ll learn what XIRR is, how it works, why it matters, how to calculate it using Excel and Google Sheets, and how to interpret your mutual fund returns with confidence.
What Is XIRR in Mutual Fund?
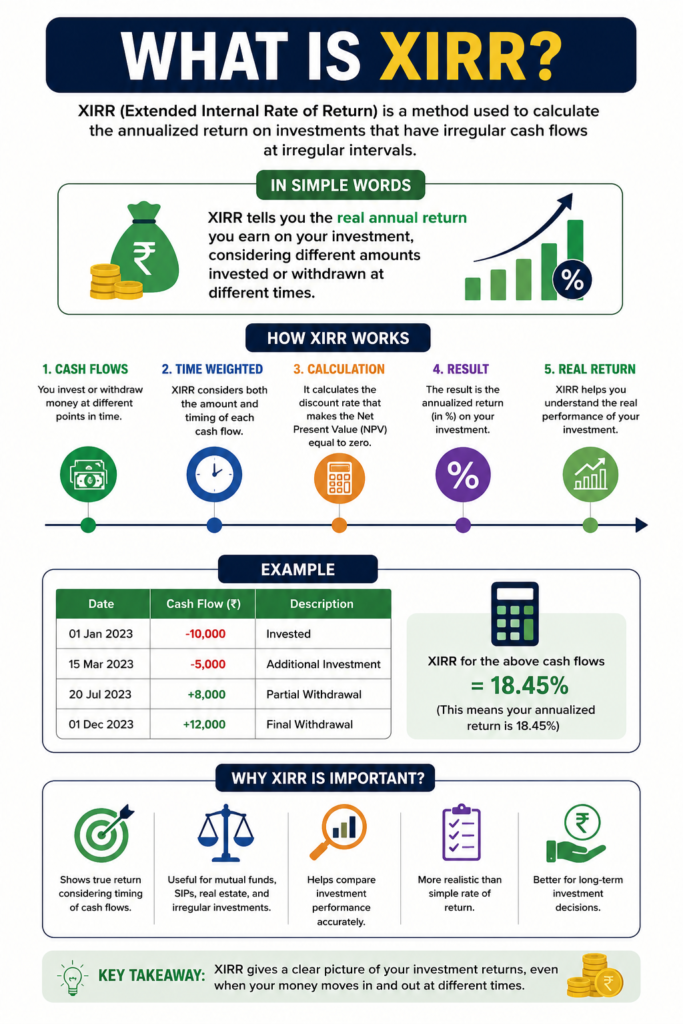
XIRR stands for Extended Internal Rate of Return. It is a financial metric used to calculate the annualized return on investments that involve multiple cash flows occurring on different dates.
In mutual funds, investors rarely invest just once. Most people invest through SIPs, increase their investments over time, pause their SIPs, make additional lump sum purchases, or redeem units partially. Since every transaction occurs on a different date, calculating returns using a simple percentage would not provide an accurate result.
XIRR solves this problem by taking into account:
- Every investment amount
- Every investment date
- Every withdrawal
- The current value of the investment
Using this information, XIRR calculates the annual rate of return that reflects the true performance of your investment.
For example, imagine you invest ₹5,000 every month through an SIP. Your January investment has been invested for twelve months, while your December investment has only been invested for one month. Clearly, both investments should not earn the same return. XIRR adjusts for these differences automatically.
This is why almost every mutual fund platform displays XIRR instead of a simple percentage return.
Simple Definition
XIRR is the annual percentage return earned on mutual fund investments after considering every investment amount and its corresponding date.
Easy Real-Life Example
Imagine two friends decide to invest in the same mutual fund.
Rahul
Invests ₹1,20,000 once in January.
Aman
Invests ₹10,000 every month through SIP.
After one year, both portfolios are worth ₹1,35,000.
At first glance, it appears they earned the same return.
However, Rahul’s money remained invested for the full year, while Aman’s later SIP installments were invested for much shorter periods.
Since the investment durations differ, their actual annual returns are not the same.
XIRR calculates the exact annualized return for both investors based on their unique investment timelines.
Full Form of XIRR
XIRR stands for Extended Internal Rate of Return.
Let’s understand each word.
Extended
Unlike the standard Internal Rate of Return (IRR), XIRR works with investments made on irregular dates instead of fixed intervals.
Internal
It measures the return generated internally by your own investment cash flows without relying on external market benchmarks.
Rate
The result is expressed as an annual percentage.
Return
It represents the annual growth achieved by your investment.
Together, XIRR provides the annualized return for investments made at irregular intervals.
Why Is XIRR Important in Mutual Funds?
Most mutual fund investors today invest through SIPs rather than making a single lump sum investment.
Every SIP installment enters the market on a different date and remains invested for a different length of time.
For example:
January SIP has remained invested for 12 months.
February SIP has remained invested for 11 months.
March SIP has remained invested for 10 months.
April SIP has remained invested for 9 months.
Since every investment experiences different market movements, calculating returns using a simple percentage would be misleading.
XIRR solves this issue by assigning the correct weight to every cash flow based on its investment duration.
This makes it the preferred performance measurement method across the mutual fund industry.
Why Mutual Fund Companies Use XIRR
Asset management companies (AMCs), financial advisors, and investment platforms use XIRR because it provides a realistic measure of investment performance.
It is especially useful when investors:
- Invest monthly through SIPs
- Make additional lump sum investments
- Pause SIPs
- Withdraw money partially
- Redeem investments on different dates
- Switch between mutual fund schemes
Since all these activities involve multiple cash flows, XIRR becomes the most reliable method of calculating returns.
Where Can You See XIRR?
Most investment platforms automatically calculate XIRR for your portfolio.
You may find it in:
- Mutual fund mobile apps
- Online investment platforms
- AMC account statements
- Portfolio tracking applications
- Wealth management dashboards
- Financial advisor reports
Instead of calculating it manually every time, these platforms update your XIRR automatically whenever the value of your investments changes.
How Does XIRR Work?

XIRR works by analyzing every cash flow in your investment journey.
It considers four important factors:
Investment Amount
Every SIP installment or lump sum investment is included.
For example:
₹5,000
₹10,000
₹15,000
Every investment affects the final return.
Investment Date
The exact date of every investment matters.
Money invested earlier has more time to grow than money invested later.
Withdrawal Date
If you redeem units or withdraw money, XIRR includes those transactions as well.
This provides a realistic picture of your returns.
Current Portfolio Value
The present value of your investment is treated as the final cash inflow.
This completes the calculation.
Understanding XIRR with a Simple Timeline
Imagine you start an SIP in January.
| Month | Investment |
|---|---|
| January | ₹5,000 |
| February | ₹5,000 |
| March | ₹5,000 |
| April | ₹5,000 |
| May | ₹5,000 |
| June | ₹5,000 |
After one year, your investment value becomes ₹34,800.
Your total investment is ₹30,000.
Many investors divide the profit by the investment amount and conclude that they earned a 16% return.
This is incorrect because the January investment stayed invested much longer than the June investment.
XIRR evaluates each installment separately before calculating the annualized return.
This makes the result much more accurate.
Why Simple Return Can Be Misleading
Suppose you invested ₹1,00,000 in a lump sum.
After one year, it became ₹1,10,000.
Your return is 10%.
Now imagine another investor invests:
- ₹20,000 in January
- ₹20,000 in March
- ₹20,000 in May
- ₹20,000 in July
- ₹20,000 in September
The total investment is also ₹1,00,000.
The portfolio value after one year is ₹1,10,000.
Although both investors have invested the same amount and reached the same portfolio value, their annualized returns are different because the second investor’s money entered the market gradually.
XIRR correctly accounts for this difference.
When Should You Use XIRR?
XIRR is the best choice whenever your investment involves multiple transactions.
You should use XIRR if you:
- Invest through SIPs
- Add extra lump sum investments
- Pause your SIP occasionally
- Redeem part of your investment
- Switch between mutual fund schemes
- Track long-term portfolio performance
- Compare two SIP investments
- Evaluate retirement investments
- Measure annualized returns accurately
If you invest only once and never make additional transactions, CAGR is often sufficient. However, for most mutual fund investors using SIPs or making multiple investments, XIRR provides a more realistic measure of performance.
Key Takeaways
XIRR is one of the most important metrics every mutual fund investor should understand. It goes beyond simple profit calculations by considering the timing and amount of every investment and withdrawal. Because it reflects the true annualized return of investments made at irregular intervals, it has become the industry standard for measuring SIP performance and overall mutual fund returns.
Instead of relying on basic percentage gains, using XIRR allows you to compare investments fairly, monitor portfolio growth accurately, and make more informed financial decisions.
How Is XIRR Calculated?
Although XIRR may sound complicated, you don’t need to solve complex mathematical equations yourself. Today, spreadsheet software like Microsoft Excel and Google Sheets can calculate XIRR in seconds.
Behind the scenes, XIRR uses an iterative financial algorithm to find the annualized rate of return that makes the present value of all cash inflows and outflows equal. In simple terms, it calculates the single annual return that best matches all your investment transactions, regardless of when they occurred.
To calculate XIRR accurately, you only need two things:
- The amount of every cash flow
- The exact date of every cash flow
Every investment is treated as a negative value because money is leaving your bank account, while the current portfolio value or redemption amount is entered as a positive value because money is coming back to you.
XIRR Formula
The mathematical formula for XIRR is:∑(1+r)(di−d0)/365Pi=0
Where:
- Pi = Cash flow (investment or redemption)
- r = XIRR (annualized return)
- di = Date of each transaction
- d0 = First investment date
Don’t worry if this formula looks intimidating. Most investors never calculate XIRR manually because Excel, Google Sheets, and mutual fund platforms perform the calculation automatically.
The important thing is to understand what information the formula uses rather than memorizing the equation.
Information Required to Calculate XIRR
Before calculating XIRR, collect the following details:
| Requirement | Example |
|---|---|
| Investment Date | 5 January 2026 |
| Investment Amount | ₹5,000 |
| Every SIP Date | Monthly |
| Additional Investments | If any |
| Partial Withdrawals | If any |
| Current Portfolio Value | ₹68,450 |
The more accurate your transaction history, the more accurate your XIRR result will be.
Example 1: Lump Sum Investment
Suppose you invested ₹1,00,000 in a mutual fund.
| Date | Cash Flow |
|---|---|
| 1 Jan 2025 | -₹1,00,000 |
| 1 Jan 2026 | ₹1,14,000 |
Since there is only one investment and one redemption after one year, the XIRR is approximately 14%.
In this simple case, XIRR and CAGR are almost identical because there are no multiple cash flows.
Example 2: SIP Investment
Now consider a monthly SIP.
| Date | Investment |
|---|---|
| 5 Jan | -₹5,000 |
| 5 Feb | -₹5,000 |
| 5 Mar | -₹5,000 |
| 5 Apr | -₹5,000 |
| 5 May | -₹5,000 |
| 5 Jun | -₹5,000 |
| Current Value | ₹33,800 |
Here, your total investment is ₹30,000, but each installment has remained invested for a different duration.
Instead of using a simple percentage return, Excel calculates the annualized return based on all investment dates. Suppose the calculated XIRR is 15.8%.
This means your mutual fund has generated an annualized return of 15.8% considering the timing of every SIP installment.
Why Timing Matters
Let’s compare two investors.
Investor A
Invests ₹1,20,000 on 1 January.
Investor B
Invests ₹10,000 every month for one year.
At the end of the year, both portfolios are worth ₹1,35,000.
A simple calculation might suggest both earned the same return. However, Investor A’s money stayed invested for the full year, while Investor B’s later installments had much less time to grow.
XIRR captures this difference and provides a fair comparison.
How to Calculate XIRR in Microsoft Excel
Microsoft Excel includes a built-in XIRR function, making the calculation quick and accurate.
Step 1: Enter Investment Dates
Create a column containing all transaction dates.
Example:
| A |
|---|
| 05-Jan-2026 |
| 05-Feb-2026 |
| 05-Mar-2026 |
| 05-Apr-2026 |
| 05-May-2026 |
| 05-Jun-2026 |
| 30-Dec-2026 |
Step 2: Enter Cash Flows
Create another column with investment amounts.
Remember:
- Investments are negative values.
- Current portfolio value is a positive value.
| B |
|---|
| -5000 |
| -5000 |
| -5000 |
| -5000 |
| -5000 |
| -5000 |
| 34800 |
Step 3: Apply the Formula
In an empty cell, type:
=XIRR(B2:B8,A2:A8)Press Enter.
Excel returns the annualized return percentage.
Understanding the Excel Formula
The formula has two parts:
=XIRR(values, dates)Values
This includes every investment and the final portfolio value.
Example:
-5000
-5000
-5000
34800
Dates
This includes the exact transaction dates.
Excel automatically calculates the number of days between every transaction.
Formatting the Result
If Excel returns:
0.1582Simply change the cell format to Percentage.
The result becomes:
15.82%Common Excel Errors
Error: #NUM!
Possible reasons:
- No positive cash flow entered
- No negative cash flow entered
- Incorrect transaction dates
- Duplicate dates with invalid entries
Error: #VALUE!
Usually caused by:
- Dates stored as text
- Invalid date format
- Non-numeric values
Tips for Accurate Excel Calculation
- Always use actual transaction dates.
- Include every SIP installment.
- Enter investments as negative values.
- Enter current value or redemption amount as a positive value.
- Avoid manually estimating dates.
How to Calculate XIRR in Google Sheets
Google Sheets uses the same function as Excel.
Suppose your data looks like this:
| Date | Cash Flow |
|---|---|
| 05-Jan | -5000 |
| 05-Feb | -5000 |
| 05-Mar | -5000 |
| 05-Apr | -5000 |
| 05-May | -5000 |
| 05-Jun | -5000 |
| 30-Dec | 34800 |
Formula:
=XIRR(B2:B8,A2:A8)Press Enter.
Google Sheets immediately calculates the annualized return.
Practical Example with SIP
Let’s consider a realistic investment journey.
SIP Amount
₹10,000 every month
Duration
12 months
Total Investment
₹1,20,000
Current Value
₹1,38,600
Excel calculates an XIRR of approximately 16.4%.
This indicates that, after accounting for the timing of every monthly investment, the annualized return is 16.4%.
Example with Additional Lump Sum Investment
Suppose you invest:
| Date | Investment |
|---|---|
| January | -₹10,000 |
| February | -₹10,000 |
| March | -₹50,000 |
| April | -₹10,000 |
| May | -₹10,000 |
| December | ₹1,05,000 |
Here, the ₹50,000 lump sum invested in March had a significant impact on your portfolio. XIRR accounts for this larger cash flow and its investment duration, giving you a more accurate annualized return than a simple average.
Example with Partial Redemption
Imagine the following transactions:
| Date | Cash Flow |
|---|---|
| January | -₹20,000 |
| March | -₹20,000 |
| June | ₹15,000 |
| December | ₹32,500 |
The ₹15,000 received in June is treated as a positive cash flow because it represents money coming back to you. The remaining portfolio value in December is also entered as a positive cash flow.
XIRR uses both of these inflows along with the investment dates to calculate the overall annualized return.
Can XIRR Be Negative?
Yes.
A negative XIRR means your investments have lost value after considering the timing of your cash flows.
For example:
| Total Investment | Current Value |
|---|---|
| ₹2,00,000 | ₹1,78,000 |
Depending on the investment dates, your XIRR may be around -8%.
A negative XIRR doesn’t necessarily mean you made poor investment decisions. Market downturns are a normal part of long-term investing, and temporary declines can occur even in well-managed mutual funds.
Does a Higher XIRR Always Mean Better Performance?
Not necessarily.
A very high XIRR over a short period could be due to exceptional market conditions and may not be sustainable. It’s also important to consider the level of risk taken to achieve those returns.
When evaluating mutual funds, look beyond XIRR and also consider:
- Investment objective
- Fund category
- Consistency over multiple years
- Expense ratio
- Risk-adjusted performance
- Portfolio diversification
A fund with a steady 12–15% XIRR over many years may be a stronger long-term choice than one with highly volatile returns.
Key Takeaways
XIRR is easy to calculate using Excel or Google Sheets once you understand how cash flows work. By entering every investment as a negative value, every redemption or current portfolio value as a positive value, and using the correct transaction dates, you can accurately measure your annualized mutual fund returns.
Unlike simple return calculations, XIRR reflects the true performance of investments made at different times, making it the preferred method for evaluating SIPs and portfolios with multiple transactions.
XIRR vs CAGR: Which One Should Mutual Fund Investors Use?
One of the most common questions investors ask is whether they should use XIRR or CAGR to measure mutual fund returns.
The answer depends on how you invested your money.
If you made a single lump sum investment and held it without adding or withdrawing money, CAGR is usually sufficient.
However, if you invested through a Systematic Investment Plan (SIP) or made multiple investments at different times, XIRR provides a much more accurate measure of performance.
Let’s understand why.
What Is CAGR?
CAGR stands for Compound Annual Growth Rate.
It measures the average annual growth rate of an investment over a specific period, assuming the investment grows at a steady rate every year.
Unlike XIRR, CAGR assumes:
- Only one investment is made.
- No additional money is invested later.
- No withdrawals occur before the investment ends.
Because of these assumptions, CAGR works best for lump sum investments.
CAGR Example
Suppose you invest ₹2,00,000 in a mutual fund.
After five years, your investment grows to ₹3,60,000.
Since you invested only once and never added more money, CAGR accurately calculates the annualized return.
However, this situation is uncommon for many retail investors, who often invest through SIPs or make additional contributions over time.
Why CAGR Is Not Suitable for SIPs
Imagine you invest:
- ₹5,000 every month
- For three years
The first SIP installment remains invested for 36 months.
The last SIP installment remains invested for only one month.
If you use CAGR, it incorrectly assumes that all ₹1,80,000 was invested on the same day.
As a result, the calculated return will not accurately reflect your investment experience.
This is why mutual fund companies use XIRR instead of CAGR for SIP investments.
XIRR vs CAGR Comparison
| Feature | XIRR | CAGR |
|---|---|---|
| Full Form | Extended Internal Rate of Return | Compound Annual Growth Rate |
| Best for | SIPs and multiple cash flows | Lump sum investments |
| Considers investment dates | Yes | No |
| Considers additional investments | Yes | No |
| Considers withdrawals | Yes | No |
| Annualized return | Yes | Yes |
| Accuracy for SIPs | Excellent | Poor |
| Used by mutual fund platforms | Yes | Limited |
| Suitable for portfolio tracking | Yes | Only for single investments |
Winner
- Lump Sum Investment: CAGR
- SIP Investment: XIRR
Example Comparing XIRR and CAGR
Investor A
Invests ₹3,00,000 once.
Value after three years:
₹4,25,000
CAGR works perfectly.
Investor B
Invests ₹10,000 every month.
Total investment:
₹3,60,000
Current value:
₹4,25,000
Since every installment entered the market on a different date, XIRR provides a much more accurate annualized return.
XIRR vs Absolute Return
Many investors also confuse XIRR with Absolute Return.
Although both measure investment performance, they answer different questions.
What Is Absolute Return?
Absolute Return simply measures the total percentage gain or loss on an investment without considering how long the money remained invested.
Formula
Absolute Return=InvestmentCurrent Value – Investment×100
Example
Investment:
₹1,00,000
Current Value:
₹1,20,000
Absolute Return:
20%
This tells you that your investment increased by 20%.
However, it does not tell you whether it took:
- Six months
- Two years
- Five years
Without considering time, Absolute Return cannot fairly compare different investments.
When Should You Use Absolute Return?
Absolute Return is useful when:
- The investment period is less than one year.
- You want a quick overview of profit or loss.
- You are comparing short-term investments.
For long-term mutual fund investments, XIRR or CAGR provides a more meaningful picture.
XIRR vs Absolute Return Comparison
| Feature | XIRR | Absolute Return |
|---|---|---|
| Considers time | Yes | No |
| Annualized | Yes | No |
| Suitable for SIP | Yes | No |
| Suitable for lump sum | Yes | Yes |
| Handles multiple cash flows | Yes | No |
| Accuracy | High | Moderate |
Example
Suppose two investors each earn a 25% Absolute Return.
Investor A achieves it in one year.
Investor B achieves it in four years.
The Absolute Return is the same, but their annual performance is very different.
XIRR captures this difference by annualizing the returns.
XIRR vs IRR
Another common source of confusion is the difference between IRR and XIRR.
Although they are related, they are designed for different situations.
What Is IRR?
IRR stands for Internal Rate of Return.
It calculates returns when cash flows occur at equal time intervals.
For example:
- Every month
- Every quarter
- Every year
Traditional IRR assumes all cash flows follow a regular schedule.
Why XIRR Was Introduced
In real life, investments rarely happen at perfectly regular intervals.
For example:
- SIP delayed by a few days
- Additional investment in the middle of the month
- Partial redemption
- Dividend reinvestment
- One-time top-up investment
These irregular transactions cannot be handled accurately using standard IRR.
XIRR solves this limitation by allowing each transaction to have its own date.
XIRR vs IRR Comparison
| Feature | XIRR | IRR |
|---|---|---|
| Investment dates | Irregular | Regular |
| Suitable for mutual funds | Yes | Limited |
| Handles SIP | Yes | No |
| Handles additional investments | Yes | Limited |
| Used in Excel | Yes | Yes |
| Accuracy for real portfolios | Very High | Moderate |
Which Return Metric Should You Use?
| Investment Type | Recommended Metric |
|---|---|
| One-time lump sum | CAGR |
| Monthly SIP | XIRR |
| Multiple investments | XIRR |
| Portfolio with withdrawals | XIRR |
| Investment below one year | Absolute Return |
| Business projects | IRR |
Advantages of XIRR
There are several reasons why financial experts recommend using XIRR to evaluate mutual fund performance.
1. Accurate for SIP Investments
XIRR accounts for the exact timing of each SIP installment, making it the preferred choice for systematic investments.
2. Considers Every Cash Flow
Whether you make additional investments, pause your SIP, or redeem units, XIRR includes every transaction in the calculation.
3. Annualized Return
The result is expressed as an annual percentage, making it easier to compare investments with different durations.
4. Industry Standard
Most mutual fund platforms, portfolio trackers, and financial advisors use XIRR because it reflects real-world investing more accurately than simple return calculations.
5. Easy to Calculate
Modern spreadsheet software and investment platforms calculate XIRR automatically, so investors do not need advanced financial knowledge.
6. Helps Compare Mutual Funds Fairly
Because XIRR adjusts for differences in investment timing, it allows investors to compare the performance of multiple funds more meaningfully.
Limitations of XIRR
Although XIRR is highly useful, it also has some limitations.
1. Requires Accurate Transaction Dates
Even a small error in dates can affect the result.
2. Depends on Correct Cash Flows
Missing an SIP installment or forgetting to include a redemption can produce misleading returns.
3. Doesn’t Predict Future Returns
XIRR measures past performance only. A high historical XIRR does not guarantee similar returns in the future.
4. Doesn’t Measure Investment Risk
Two mutual funds may have the same XIRR, but one could have experienced much greater volatility. Investors should also evaluate risk-adjusted metrics, portfolio quality, and investment objectives.
5. Short-Term Results Can Be Misleading
A very high XIRR over a few months may simply reflect favorable market conditions rather than consistent long-term performance.
Common Myths About XIRR
Myth 1: Higher XIRR Always Means a Better Fund
Not necessarily. High returns achieved through excessive risk may not be suitable for every investor.
Myth 2: XIRR and CAGR Are the Same
No. CAGR is best suited for single lump sum investments, while XIRR is designed for investments with multiple cash flows.
Myth 3: You Need to Calculate XIRR Manually
Modern investment platforms, Excel, and Google Sheets calculate XIRR automatically.
Myth 4: XIRR Guarantees Future Returns
XIRR is a measure of historical performance. It should be used alongside other factors such as fund strategy, expense ratio, risk profile, and consistency.
When Should You Use XIRR?
Use XIRR if you:
- Invest through SIPs.
- Make additional lump sum investments.
- Withdraw money partially.
- Compare mutual fund portfolios.
- Track retirement investments.
- Monitor long-term wealth creation.
- Evaluate annualized portfolio performance.
If your investment consists of only one purchase with no additional transactions, CAGR remains a suitable option.
Key Takeaways
Choosing the right return metric is essential for understanding your investment performance. While CAGR is ideal for single lump sum investments and Absolute Return offers a quick snapshot of gains or losses, XIRR is the most reliable measure for portfolios with multiple cash flows, such as SIPs.
By considering the timing of every investment and withdrawal, XIRR provides a realistic annualized return that helps investors compare funds fairly and make better financial decisions.
What Is a Good XIRR in Mutual Funds?
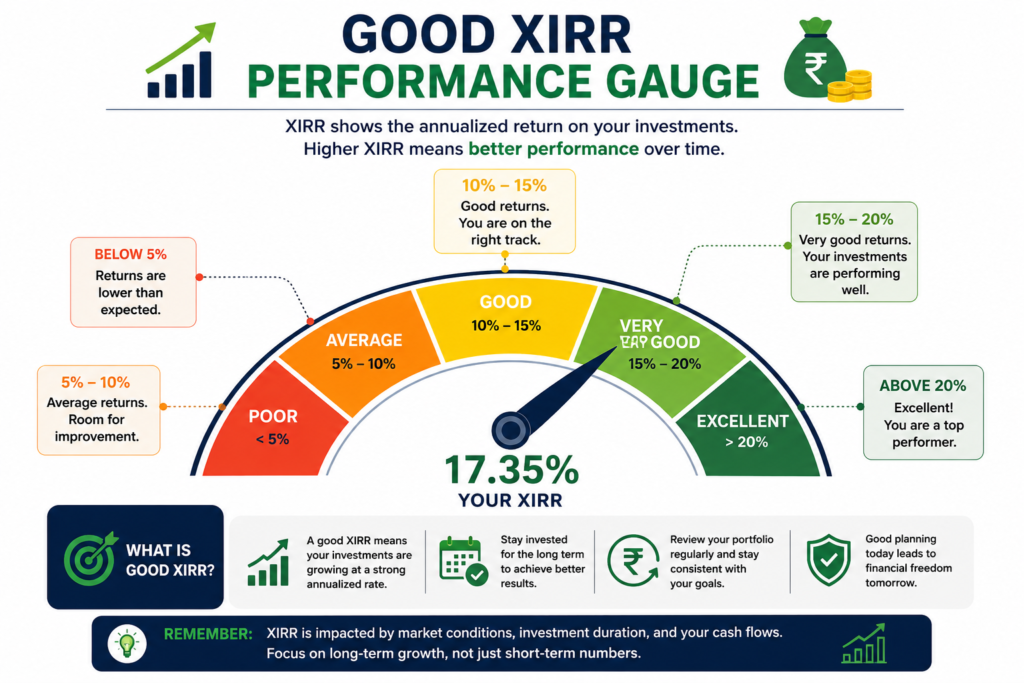
One of the most frequently asked questions by investors is, “What is considered a good XIRR in mutual funds?”
The answer depends on several factors, including:
- The type of mutual fund
- Market conditions
- Investment duration
- Risk level
- Economic environment
There is no fixed XIRR that guarantees a fund is “good.” However, understanding general return ranges can help you interpret your portfolio’s performance more effectively.
General XIRR Benchmarks
| Annual XIRR | General Interpretation |
|---|---|
| Below 8% | Lower return; may reflect conservative funds or weak market conditions |
| 8%–12% | Reasonable long-term range for many diversified portfolios |
| 12%–15% | Strong long-term performance, depending on the fund category |
| Above 15% | High return; evaluate whether it is sustainable and consistent |
These ranges are broad guidelines, not guarantees. Equity funds, debt funds, hybrid funds, and international funds can have very different return expectations.
The most important point is to compare your XIRR with an appropriate benchmark and similar funds rather than aiming for the highest number alone.
Should You Compare XIRR with Bank Fixed Deposits?
Many beginners compare mutual fund returns with fixed deposit (FD) interest rates.
Although this comparison is common, it is not always appropriate because the two investment options have different objectives and risk profiles.
For example:
- Fixed deposits generally offer predictable returns.
- Equity mutual funds aim for long-term capital growth and may experience short-term fluctuations.
Rather than comparing only the percentage return, consider:
- Investment horizon
- Risk tolerance
- Liquidity requirements
- Financial goals
How Mutual Fund Apps Calculate XIRR
If you’ve ever logged into your investment app and seen an XIRR figure, you may wonder how it is generated.
The process is straightforward:
- Every purchase transaction is recorded.
- Every SIP installment is stored with its exact date.
- Any additional investments are included.
- Redemptions and withdrawals are added as cash inflows.
- The latest portfolio value is treated as the final positive cash flow.
- The XIRR algorithm calculates the annualized return.
Whenever the portfolio value changes because of market movements or new transactions, the XIRR is updated automatically.
Why Your XIRR Changes Every Day
Many investors become concerned when they notice their XIRR increasing or decreasing daily.
This is perfectly normal.
Your XIRR changes because:
- Mutual fund NAV changes daily.
- Market prices fluctuate.
- New SIP installments are added.
- Additional investments are made.
- Partial redemptions occur.
Daily fluctuations do not necessarily indicate that your investment strategy has changed. Instead, they reflect the updated value of your portfolio.
Why Your XIRR Changes Every Day
Many investors become concerned when they notice their XIRR increasing or decreasing daily.
This is perfectly normal.
Your XIRR changes because:
- Mutual fund NAV changes daily.
- Market prices fluctuate.
- New SIP installments are added.
- Additional investments are made.
- Partial redemptions occur.
Daily fluctuations do not necessarily indicate that your investment strategy has changed. Instead, they reflect the updated value of your portfolio.
Common Mistakes Investors Make When Checking XIRR
Understanding XIRR is important, but interpreting it correctly is equally essential.
Here are some common mistakes to avoid.
1. Comparing XIRR with Absolute Return
Absolute Return and XIRR measure different aspects of performance.
Absolute Return ignores the investment period, whereas XIRR annualizes the return.
2. Ignoring Investment Duration
A 15% XIRR over ten years generally carries more significance than a 20% XIRR achieved over only a few months.
Consistency over time is often more meaningful than short-term performance.
3. Looking Only at Returns
Returns should never be the sole factor when selecting a mutual fund.
Also consider:
- Risk level
- Expense ratio
- Fund manager’s track record
- Portfolio quality
- Investment objective
- Asset allocation
4. Using Incorrect Dates in Excel
Even a small error in transaction dates can lead to an inaccurate XIRR.
Always use the exact investment and redemption dates from your account statement.
5. Forgetting Cash Flows
If you omit:
- Additional investments
- Partial withdrawals
- Dividend payouts (where applicable)
the calculated XIRR may not accurately reflect your investment performance.
Tips to Improve Your Long-Term Mutual Fund Returns
While you cannot directly control your XIRR, you can follow disciplined investing practices that may improve long-term outcomes.
Invest Regularly
Consistent SIP investments help average purchase costs over time.
Stay Invested
Long-term investing allows your portfolio more time to recover from market volatility and benefit from compounding.
Increase SIP Amounts
As your income grows, increasing your SIP contributions can help you build wealth faster.
Diversify Your Portfolio
Holding investments across different asset classes and fund categories can reduce concentration risk.
Review Your Portfolio Periodically
Review your investments at regular intervals to ensure they continue to align with your financial goals and risk tolerance.
Frequently Asked Questions (FAQs)
1. What is XIRR in a mutual fund?
XIRR (Extended Internal Rate of Return) is the annualized return on investments with multiple cash flows occurring on different dates. It is widely used to measure SIP performance.
2. Why is XIRR used instead of CAGR?
CAGR assumes a single investment, whereas XIRR accounts for multiple investments and withdrawals made on different dates.
3. Is XIRR better than Absolute Return?
For long-term investments involving multiple transactions, XIRR generally provides a more accurate picture because it considers both time and cash flows.
4. Is XIRR applicable only to SIPs?
No. XIRR can also be used for portfolios with additional lump sum investments, withdrawals, or irregular cash flows.
5. Can XIRR be negative?
Yes. A negative XIRR indicates that the investment has declined in value after considering all cash flows and their timing.
6. Does a higher XIRR always mean a better investment?
Not necessarily. Returns should be evaluated alongside risk, consistency, costs, and investment objectives.
7. Is XIRR calculated annually?
Yes. XIRR represents an annualized rate of return.
8. Can I calculate XIRR without Excel?
Yes. Many investment platforms and online calculators automatically calculate XIRR when you enter transaction details.
9. What happens if I miss an SIP installment?
Missing an SIP installment does not prevent XIRR from being calculated. The calculation simply reflects the actual cash flows that occurred.
10. Is XIRR useful for retirement planning?
Yes. Since retirement portfolios often involve regular contributions over many years, XIRR is an effective way to monitor long-term performance.
11. How often should I check my XIRR?
Reviewing it periodically, such as quarterly or annually, is generally more useful than monitoring daily fluctuations.
12. Is XIRR the same as ROI?
No. ROI measures total return, while XIRR annualizes returns and accounts for the timing of each cash flow.
13. Can I compare the XIRR of two different mutual funds?
Yes, provided they belong to similar categories and are evaluated over comparable investment periods.
14. Does XIRR include dividends?
If dividend payouts or reinvestments are entered correctly as cash flows, they are reflected in the XIRR calculation.
15. Why does my XIRR keep changing?
XIRR changes because the market value of your investments changes and new transactions may occur over time.
Key Takeaways
- XIRR stands for Extended Internal Rate of Return.
- It is the preferred method for measuring SIP and multi-transaction mutual fund returns.
- XIRR considers both the amount and timing of every investment and withdrawal.
- It provides an annualized return, making comparisons more meaningful.
- Excel and Google Sheets can calculate XIRR using a built-in function.
- XIRR is generally more appropriate than CAGR for SIP investors.
- Historical XIRR should not be viewed as a guarantee of future performance.
Final Conclusion
Understanding what XIRR is in mutual funds is essential for anyone who wants to evaluate investment performance accurately. Unlike simple return calculations, XIRR recognizes that every investment is made at a different time and adjusts the annualized return accordingly.
Whether you invest through a monthly SIP, make occasional lump sum investments, or withdraw money during your investment journey, XIRR provides a realistic view of how your portfolio has performed. It has become the industry standard because it reflects real-world investing more accurately than metrics that ignore cash flow timing.
Remember, XIRR is just one tool in your investment toolkit. A well-informed decision should also consider your financial goals, investment horizon, risk tolerance, asset allocation, and the quality of the mutual fund itself.
By understanding how XIRR works and using it alongside other important factors, you can make more confident and informed investment decisions.
Natalie Kingsley is the lead author and primary contributor at Fundznests.com. She is passionate about financial education and dedicated to helping readers build confidence in managing their money, growing their wealth, and achieving long-term financial goals.
With a strong interest in personal finance, investing, retirement planning, and wealth-building strategies, Natalie creates informative and practical content designed for both beginners and experienced investors. Her writing focuses on breaking down complex financial concepts into clear, actionable insights that readers can apply to their everyday financial lives.